
PM
Product Metrics Interviews: What PMs Are Expected to Know
Most PM candidates walk into product metrics interviews thinking they’re about memorizing KPIs. Interviewers, however, are testing something deeper: how you ...

Most PM candidates walk into product metrics interviews thinking they’re about memorizing KPIs. Interviewers, however, are testing something deeper: how you think about causality, behavior, and tradeoffs using data.
This post is a practical guide to product metrics interviews—what PMs are actually expected to know, how to structure your answers, and how to avoid the traps that derail otherwise strong candidates. We’ll cover north star metrics, supporting metrics, product analytics fundamentals, and real interview-style examples.
What Product Metrics Interviews Are Really Testing
At a good company, a PM metrics interview is not a trivia quiz (“What’s DAU?”). It’s an assessment of:
-
Problem framing
Can you translate a vague goal (“Improve engagement”) into measurable definitions? -
Metric design
Can you define good product metrics—clear, robust, actionable, and aligned with strategy? -
Analytical reasoning
Can you reason about funnels, cohorts, and experiments at a conceptual level? -
Tradeoff awareness
Do you understand how optimizing one metric can harm another (e.g., engagement vs. trust)? -
Communication
Can you explain metrics and reasoning clearly to non-technical stakeholders?
If you keep these five dimensions in mind, it becomes much easier to structure strong answers in a PM metrics interview.
Core Concepts Every PM Should Know About Product Metrics
Before diving into interview patterns, you need a solid foundation in product analytics and product metrics vocabulary.
Types of product metrics
Most metrics fall into a few broad categories:
-
Acquisition metrics
- Examples: new users per day, sign-up conversion rate, cost per acquisition (CPA)
- Question: How efficiently are we bringing users into the product?
-
Activation metrics
- Examples: time to first value (TTFV), % of new users who complete onboarding, first purchase rate
- Question: Are new users reaching the “aha moment”?
-
Engagement metrics
- Examples: DAU/MAU, sessions per user per week, messages sent per user, watch time per user
- Question: Are users forming a habit or getting recurring value?
-
Retention metrics
- Examples: 7-day retention, 30-day retention, churn rate, cohort retention curves
- Question: Do users keep coming back over time?
-
Monetization metrics
- Examples: ARPU, ARPPU, LTV, conversion to paid, average order value (AOV)
- Question: Are we sustainably generating revenue from usage?
-
Quality & reliability metrics
- Examples: crash rate, p95 latency, error rate, uptime
- Question: Is the product experience technically reliable?
A strong PM can quickly map a business question to the right category and then pick appropriate metrics.
North Star Metrics: What They Are and How to Use Them
“North star metrics” are one of the most common topics in a pm metrics interview, and also one of the most misunderstood.
What is a north star metric?
A north star metric (NSM) is the single metric that best captures the long-term value your product creates for customers and the business.
Good NSMs:
- Reflect value delivered, not just activity
- Are leading indicators of revenue or strategic success
- Are understandable across the company
- Can be influenced by product teams through their work
Examples:
- Spotify: “Time spent listening to music” or “Tracks played per user per week”
- Airbnb: “Nights booked”
- Slack: “Messages sent per active team per day”
- Marketplace: “Completed transactions” or “GMV from retained buyers”
Bad NSMs:
- “Number of signups” (too shallow)
- “Page views” (can be gamed without value)
- “Revenue this quarter” (lagging, not directly actionable by product teams)
How to define a north star metric in an interview
A good structure when asked “What should be the north star metric for X?”:
-
Clarify the product’s core value
- “This product helps users do A and B. The core value is C.”
-
Identify the unit of value
- “The fundamental unit of value is [ride completed, order delivered, document collaborated on].”
-
Propose a candidate metric
- “So a natural north star metric would be [value unit] per [time period] for [retained/engaged] users.”
-
Sanity-check against properties of a good NSM
- Does it represent real user value?
- Is it a leading indicator of business outcomes?
- Is it measurable and attributable?
-
Mention supporting metrics
- “We’d complement this with supporting metrics for acquisition, activation, and retention to avoid gaming the NSM.”
Metric Trees: From North Star to Operational Metrics
Once you have a north star metric, you need to break it down into levers that teams can actually move.
Metric tree concept
A metric tree decomposes a north star metric into its logical components, like a factorization.
Example: For a subscription SaaS, suppose NSM = Active paid seats per month.
A simple metric tree:
- Active paid seats per month
- = (# of customers) × (avg seats per customer) × (seat activation rate)
-
of customers
- = (# of new customers) − (# of churned customers)
- New customers
- = (site visitors) × (signup rate) × (trial-to-paid conversion)
- Churned customers
- = (customers at start of period) × (churn rate)
This structure helps:
- Identify levers (e.g., trial conversion vs churn)
- Prioritize experiments
- Explain tradeoffs in interviews
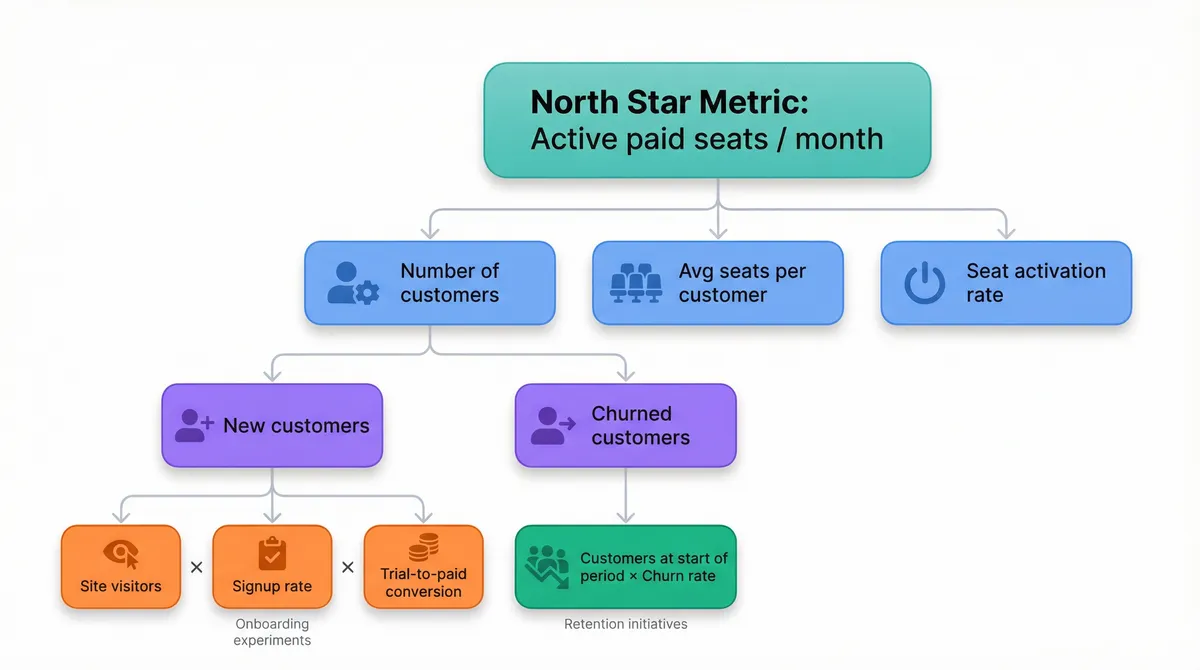
In a metrics interview, you can sketch a metric tree verbally:
- Start from NSM
- Decompose into multiplicative/additive components
- Call out which components are more elastic or easier to move
How to Answer Classic PM Metrics Interview Questions
Most pm metrics interview questions fall into a few repeatable patterns. Here’s how to approach them.
1. “What metrics would you track for X product?”
This is the most common format. Interviewers are testing breadth and prioritization.
Structured approach:
-
Clarify the product and goal
- “Is the goal growth, engagement, retention, or monetization?”
-
Propose a metric framework
- Use AARRR (Acquisition, Activation, Retention, Referral, Revenue) or a similar funnel.
-
Define 1 north star metric
- Tie it to user value.
-
Define 3–7 supporting metrics
- Cover acquisition, activation, engagement, retention, monetization.
- Make each metric precise: numerator, denominator, time window, and unit.
-
Explain why each metric matters
- One line per metric, focused on behavior and decisions.
Example: Consumer social app
-
Goal: Increase engagement.
-
North star metric:
- Daily active users (DAU) who perform a core action (e.g., post, comment, or message)
- More specific than raw DAU; focuses on meaningful engagement.
- Daily active users (DAU) who perform a core action (e.g., post, comment, or message)
-
Supporting metrics:
- DAU/MAU ratio
- Measures stickiness and habit formation.
- Sessions per DAU per day
- Captures frequency of engagement.
- Median session length
- Avoids being skewed by power users.
- 7-day and 30-day retention of new users
- Measures whether new users are forming a habit.
- Content creation rate
- % of DAU who create content; leading indicator for feed health.
- Time to first friend / follow
- Activation metric; social graph density is critical for engagement.
- DAU/MAU ratio
When answering, don’t just list metrics—tie each to a behavioral hypothesis.
2. “How would you measure the success of feature Y?”
Here the interviewer cares about: can you connect a feature to user value and define leading and lagging indicators?
Framework:
-
Restate the feature and intended behavior change
- “This feature is meant to reduce friction in X and increase Y behavior.”
-
Define a primary success metric
- A direct measure of the target behavior (e.g., completion rate of a flow).
-
Define guardrail metrics
- To ensure you don’t harm core business or user experience (e.g., revenue, error rate, complaint rate).
-
Add diagnostic metrics
- Funnel steps, drop-off points, and quality signals for debugging.
Example: “Add one-click checkout to an e-commerce app”
-
Intended behavior:
- Reduce checkout friction, increase conversion, especially on mobile and repeat purchases.
-
Primary success metrics:
- Checkout conversion rate:
- (# of orders placed) / (# of sessions that add at least one item to cart)
- Time to complete checkout:
- Median time from “Proceed to checkout” to “Order confirmed”.
- Checkout conversion rate:
-
Guardrail metrics:
- Average order value (AOV): ensure we’re not pushing low-value impulse buys that hurt margins.
- Refund / return rate: ensure faster checkout doesn’t increase regret purchases.
- Payment failure rate: ensure technical reliability.
-
Diagnostic metrics:
- Click-through rate on “One-click checkout” option
- Drop-off rate at each checkout step (for non-one-click users)
- Adoption rate among eligible users:
- (# of orders via one-click) / (# of orders from users with saved payment and address)
In an interview, explicitly distinguish primary, guardrail, and diagnostic metrics. This signals mature thinking.
3. “North star metrics for [industry/product]”
We covered NSMs conceptually; in interviews you’ll often need to tailor them.
Example: Ride-sharing app
-
Core value: reliably moving people from A to B.
-
Candidate north star metrics:
- Completed trips per active rider per week
- Or Completed trips per active city per week (if you’re thinking at a market level)
-
Supporting metrics:
- Match rate: % of ride requests that find a driver.
- ETA reliability: p95 pickup time vs promised time.
- Cancellation rate (by riders and drivers).
- Driver online hours utilization: time spent with a passenger vs idle.
When asked for a NSM:
- Offer 1–2 options
- Compare them briefly
- Pick one and justify
4. “A metric moved up/down. How do you debug it?”
This tests your ability to reason about causality and structure an investigation.
Framework:
-
Clarify the metric and the change
- Absolute vs relative change, time window, seasonality, and segments.
-
Segment the metric
- By platform (iOS/Android/web)
- By geography
- By cohort (new vs existing users)
- By traffic source (organic, paid, referral)
-
Inspect related metrics
- Upstream and downstream metrics in the funnel.
- Example: If DAU drops, check logins, signups, crash rates, latency, email deliverability.
-
Check recent changes
- Product launches, experiments, infra changes, pricing, policy.
-
Form hypotheses and design tests
- Use A/B test logs, rollbacks, or targeted experiments.
Example: “DAU dropped 10% last week. What do you do?”
-
First, confirm:
- Is it a reporting issue? (analytics pipeline, logging)
- Is it localized to a platform or region?
- Is it correlated with app version?
-
Then segment:
- New vs existing users: If new user DAU dropped, maybe acquisition or onboarding broke.
- Specific countries: Could be a regional outage or holiday.
- Device type: Could be a crash on a specific OS version.
-
Check related metrics:
- Crash rate, latency, login errors, payment failures.
- Marketing spend: Did we pause a campaign?
In an interview, walk through the process rather than jumping to a single root cause.
Product Analytics Concepts PMs Are Expected to Understand
You don’t need to be a data scientist, but you do need to be fluent in basic product analytics.
Funnels
A funnel is a sequence of steps users go through to complete a task.
Example: Signup funnel
- Visit signup page
- Start form
- Submit form
- Confirm email
- Complete profile
For each step, you track:
- Step conversion rate:
step_n / step_(n-1) - Overall funnel conversion:
final_step / first_step - Drop-off points: where users abandon
In interviews, when talking about flows (onboarding, checkout, posting content), mention funnel analysis explicitly.
Cohort analysis
A cohort is a group of users who share a characteristic, usually a start date.
Common use: retention over time.
Example:
- Define cohorts by signup week.
- For each cohort, compute % of users active in week 1, 2, 3, …
This reveals:
- Whether retention is improving with product changes.
- If older users behave differently from newer ones.
When discussing retention, mention cohort-based retention rather than just a single 30-day retention number.
Leading vs lagging metrics
- Leading indicators move early and predict future outcomes.
- Example: number of high-intent actions (add to cart, follow creators, save items).
- Lagging indicators move later and confirm outcomes.
- Example: revenue, LTV, churn.
In metrics interviews, show awareness that:
- You optimize leading indicators,
- While monitoring and validating with lagging indicators.
Correlation vs causation (and A/B testing basics)
You’re not expected to derive p-values, but you should know:
- You can’t infer causality from raw trends alone.
- A/B tests (controlled experiments) are the standard way to measure feature impact.
- Key concepts:
- Random assignment to control vs treatment.
- Sample size and duration matter.
- Avoid peeking too early and overfitting to noise.
Common Mistakes in PM Metrics Interviews
Strong candidates often stumble on predictable pitfalls. Avoid these.
1. Defining vague or unmeasurable metrics
Bad: “We’ll measure user happiness and engagement.”
Better: “We’ll measure 7-day retention and Net Promoter Score (NPS) via in-app survey.”
Always define:
- Numerator
- Denominator
- Time window
- Unit of analysis (user, session, order, etc.)
2. Choosing vanity metrics
Vanity metrics look good but don’t represent real progress.
Examples:
- Total app downloads
- Total registered users
- Total page views
Instead, prefer behavior-based, value-linked metrics:
- Weekly active engaged users
- % of new users who complete a core action within 3 days
3. Ignoring tradeoffs and guardrails
If you optimize for one metric without constraints, you can harm the product.
Examples:
- Pushing notifications to increase DAU, but hurting long-term retention and trust.
- Reducing friction to increase conversion, but increasing fraud or returns.
In interviews, always mention at least one guardrail metric.
4. Overfitting to a single metric
Real products use metric systems, not single numbers.
- NSM for direction
- Supporting metrics for levers
- Guardrails for safety
- Diagnostic metrics for learning
If you only talk about one metric, you’ll sound naive.
5. Skipping assumptions and context
Metrics only make sense in context. For instance:
- A “good” 7-day retention rate in a utility app vs a casual game is very different.
- DAU/MAU of 0.3 may be great for a monthly billing tool and poor for a chat app.
In interviews, state your assumptions explicitly:
- “I’ll assume this is a daily-use product like messaging; in that case I’d expect DAU/MAU above 0.5.”
Best Practices: How to Think Like a Metrics-Driven PM
1. Start from the user, not the metric
Metrics are proxies for user value. Before naming metrics, answer:
- Who is the user?
- What problem are we solving?
- What behavior change do we want?
Then derive metrics from that behavior.
2. Use simple, interpretable metrics first
Prefer:
- Ratios over raw counts (conversion rate vs # of signups)
- Medians over means when distributions are skewed
- Clear thresholds (e.g., “users who do X at least 3 times per week”)
Complex derived metrics are fine, but only after the basics.
3. Think in systems and feedback loops
Products are systems. Changes in one place propagate.
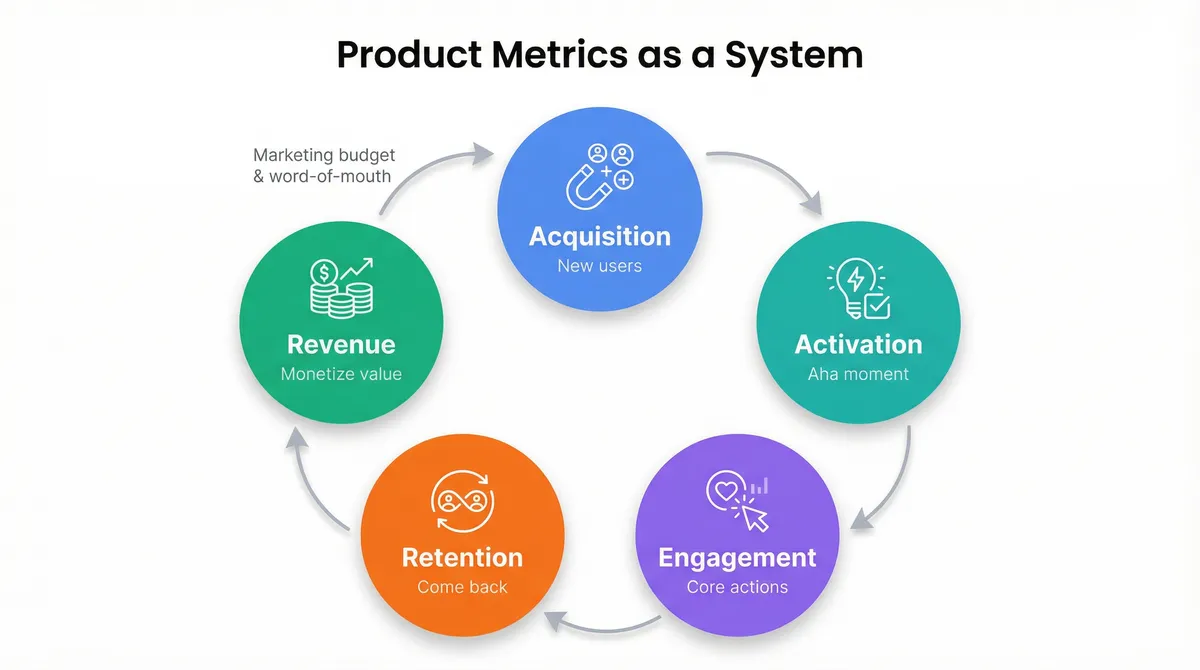
Example:
- Better activation improves engagement.
- Better engagement improves retention.
- Better retention improves LTV.
- Higher LTV justifies higher acquisition spend.
In interviews, occasionally zoom out and show that you understand these connections.
4. Segment, segment, segment
Averages hide problems.
- Segment by new vs existing users.
- Segment by geography, platform, device.
- Segment by acquisition channel.
When proposing metrics:
- Mention at least one segmentation that would be important.
5. Tie metrics to decisions
A metric is only useful if it can drive a decision or action.
When you propose a metric, add:
- “If this metric goes up/down, here’s what we’d do.”
This shows you’re not just measuring for measurement’s sake.
Example Walkthrough: A Full Metrics Interview Answer
Let’s put it all together with a realistic prompt:
“You’re the PM for a new B2C habit-tracking app. How would you measure success?”
1. Clarify the product and goal
- Users log daily habits (exercise, reading, etc.)
- The app aims to help users build and maintain habits.
- I’ll focus on engagement and retention as primary goals.
2. Define the north star metric
- Core value: helping users consistently perform habits.
- Candidate NSM:
- “Number of habit completions per weekly active user (WAU)”
Why:
- Captures actual behavior change (doing habits), not just app opens.
- Normalized per user to avoid being dominated by growth in user count.
3. Supporting metrics
-
Acquisition
- New users per week
- Signup conversion rate from landing page
-
Activation
- % of new users who create at least one habit within 24 hours
- Time from signup to first logged habit
-
Engagement
- WAU and DAU
- DAU/MAU ratio
- Average number of active habits per user (habits with at least 3 completions in past 2 weeks)
-
Retention
- 7-day and 30-day retention of new users
- Cohort-based retention curves by signup week
-
Monetization (if premium features)
- Free-to-paid conversion rate
- Revenue per WAU
4. Guardrail metrics
- App crash rate
- p95 latency for logging a habit
- Uninstall rate within first week
5. Segmentation
- New vs existing users
- Users with 1–2 habits vs power users with 5+ habits
- Users who enable reminders vs those who don’t
6. Decisions driven by metrics
-
If activation is low:
- Simplify habit creation flow
- Add templates and suggestions
-
If 7-day retention is low but activation is high:
- Improve reminders and streak mechanics
- Add social accountability features
-
If NSM (habit completions per WAU) is low but retention is okay:
- Improve in-app guidance and habit tracking UX
- Experiment with habit-specific nudges
This kind of structured walkthrough is exactly what interviewers are looking for.
Practicing Product Metrics Interviews
Like algorithms, product metrics interviews follow patterns. You can practice them deliberately:
- Take random products you use daily.
- For each, answer:
- What is the likely north star metric?
- What are 3–5 supporting metrics?
- How would you measure success of a recent feature they launched?
- How would you investigate a 10% drop in their DAU?
If you’re already using AI tools for interview preparation, you can integrate these patterns into your sessions. For example, you might simulate a dedicated product metrics round similar to how you’d practice system design or data structures patterns using structured sheets like /dsa-patterns-sheet.
Key Takeaways
- Product metrics interviews test how you think, not how many acronyms you know.
- Always start from user value and derive metrics from behavior.
- Know how to define and critique north star metrics, and break them into metric trees.
- Distinguish between primary, supporting, guardrail, and diagnostic metrics.
- Use funnels, cohorts, and segmentation to reason about product analytics.
- Avoid vanity metrics; prefer behavioral, actionable, and interpretable metrics.
- In every answer, show how metrics would drive decisions, not just dashboards.
If you can consistently structure your thinking this way, you’ll be well prepared for product metrics interviews—and better equipped to drive real impact once you’re in the role.