
Resume
How to Quantify Impact on Your Resume as a Developer
Most developer resumes read like job descriptions: “Built APIs”, “Worked on microservices”, “Improved performance.” None of that tells a hiring manager what ...

Most developer resumes read like job descriptions: “Built APIs”, “Worked on microservices”, “Improved performance.” None of that tells a hiring manager what actually changed because you were there.
Quantifying impact on your resume is how you turn “I did things” into “Here’s the measurable value I created.” For engineering roles—where data, metrics, and performance are core to the work—your resume should be just as concrete.
This guide walks through a systematic way to quantify impact on your developer resume, with examples, templates, and common pitfalls to avoid. By the end, you’ll know how to turn vague bullet points into sharp, metric-driven statements that actually get callbacks.
Why quantifying impact matters on a developer resume
Think about how you debug performance issues. You don’t say “the service felt slow.” You say “p99 latency was 1.2s, we brought it down to 350ms.” Recruiters and hiring managers read resumes the same way.
Quantified impact:
- Signals seniority – Juniors describe tasks; seniors describe outcomes.
- Makes you comparable – “Improved performance” is subjective; “reduced API latency by 40%” is not.
- Proves business awareness – You understand how your code affects users, revenue, and reliability.
- Survives resume skimming – Numbers stand out visually in a wall of text.
If you want your resume impact to be clear, you need to translate engineering work into measurable achievements.
The core formula for high-impact bullet points
Most strong developer resume bullet points follow a simple pattern:
[Action verb] + [what you did] + [how you did it] + [measurable outcome]
Example:
“Optimized core search endpoint by adding Redis caching and query batching, reducing p95 latency from 900ms to 280ms (69%) and cutting database load by ~40%.”
Here’s the same bullet without quantification:
“Improved performance of search endpoint using Redis caching and query batching.”
Same work. One looks like a senior engineer; the other looks like an intern.
Checklist for every bullet point
For each bullet on your developer resume, ask:
- What changed because I did this?
- How can I express that change with a number?
- Is this number meaningful to the business or users?
If you can’t answer (2) and (3), the bullet is likely too vague.
What can developers actually quantify?
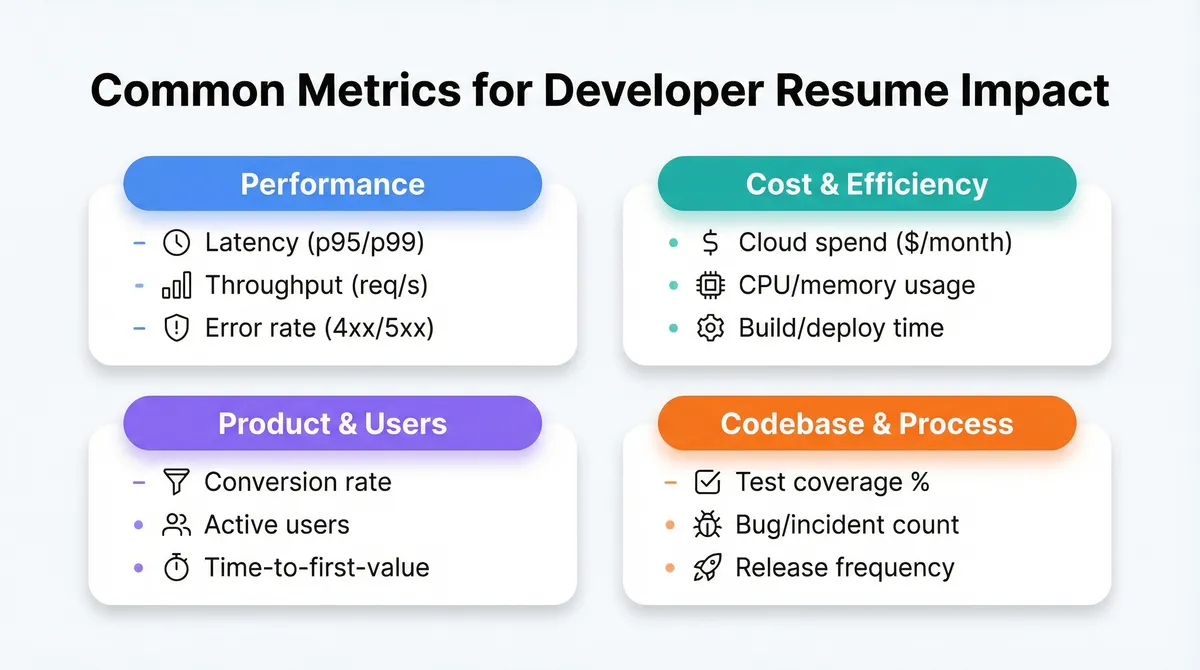
You don’t need access to company-wide dashboards to quantify impact. As a developer, you can measure:
1. Performance and reliability metrics
These are the most straightforward and resume-friendly:
- Latency (avg, p95, p99):
“Reduced p95 latency from 1.2s → 450ms (62%).” - Throughput / capacity:
“Increased system throughput from 500 → 2,000 req/s (4x).” - Error rates:
“Cut 5xx error rate from 3.1% → 0.4%.” - Uptime / availability:
“Improved service uptime from 99.5% → 99.95%.” - Resource utilization:
“Reduced CPU usage by 35% on peak traffic.”
These often come from:
- APM tools (Datadog, New Relic, Prometheus, Grafana)
- Cloud dashboards (AWS CloudWatch, GCP Monitoring, Azure Monitor)
- Internal metrics dashboards
2. Cost and efficiency metrics
Companies care a lot about cost, especially at scale:
- Infrastructure cost:
“Reduced monthly AWS spend for service X by 28% (~$3.2k/month).” - Storage / bandwidth:
“Compressed image pipeline, cutting storage usage by 40%.” - Build / deploy times:
“Reduced CI pipeline from 18 min → 7 min (61%), enabling faster iteration.” - Developer time saved:
“Automated release notes generation, saving ~2 hours per release.”
These can come from:
- Cloud billing dashboards
- CI/CD logs
- Internal tooling metrics
3. Product and user impact
You don’t need exact revenue numbers to show product impact:
- Usage / adoption:
- “Feature used by 60%+ of active users within 3 months of launch.”
- “Migrated 80% of customers to new billing system.”
- Conversion / engagement:
- “Improved signup completion rate from 68% → 81%.”
- “Increased weekly active users (WAU) for feature X by 25%.”
- Time saved for users:
- “Reduced average data import time from 15 min → 2 min.”
You can often approximate from:
- Product analytics (Amplitude, Mixpanel, internal dashboards)
- A/B test results
- Product manager updates / release notes
4. Codebase and process improvements
Even internal improvements can be quantified:
- Code reduction / simplification:
- “Refactored legacy module, reducing LOC by 35% while adding test coverage.”
- Test coverage:
- “Increased unit test coverage from 55% → 82% on core service.”
- Incident reduction:
- “Decreased on-call pages by 50% by fixing top recurring issues.”
- Release frequency:
- “Helped team move from monthly releases to weekly deployments.”
5. Scope and scale
When you can’t measure change precisely, quantify scale:
- “Service handling 10M+ daily events.”
- “API used by 15+ internal teams.”
- “Feature shipped to 200k+ monthly active users.”
- “Managed 6-node Kubernetes cluster running 40+ microservices.”
Scope doesn’t replace outcomes, but it provides valuable context.
Turning vague bullets into quantified achievements
Let’s walk through concrete transformations.
Example 1: Backend developer
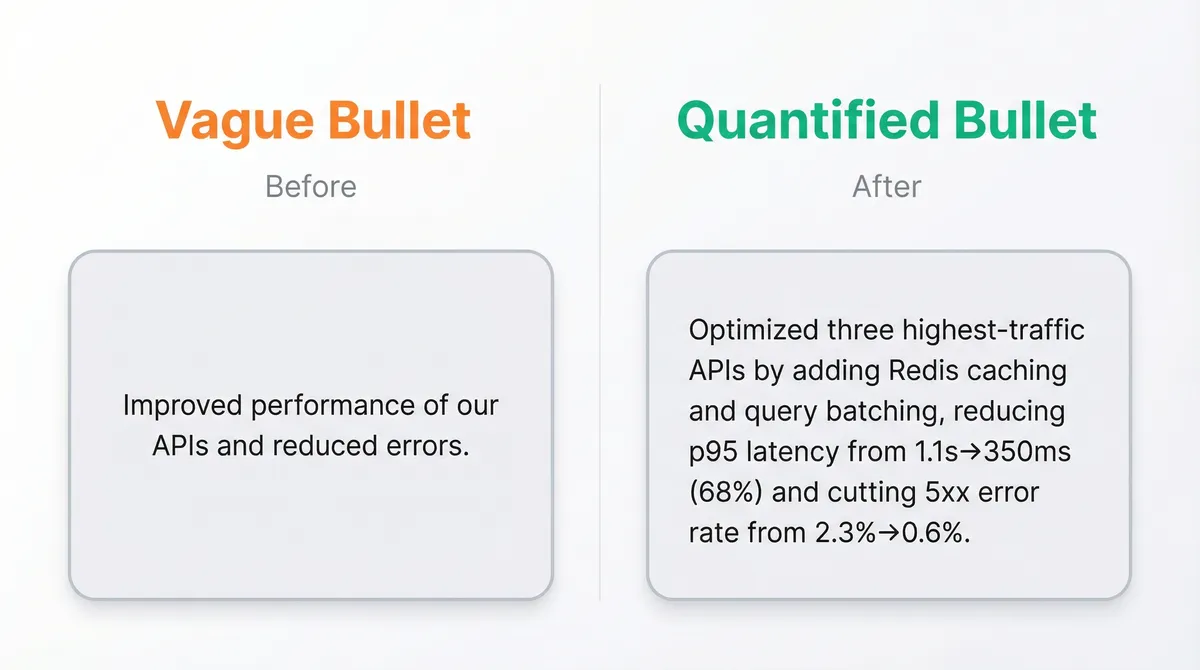
Weak:
- “Worked on improving the performance of our APIs.”
Better with quantification:
- “Optimized three highest-traffic APIs by adding Redis caching and query optimization, reducing p95 latency from 1.1s to 350ms (68%) and cutting DB read load by ~45%.”
Why it’s better:
- Specifies scope (“three highest-traffic APIs”)
- Names techniques (“Redis caching”, “query optimization”)
- Quantifies performance and load
Example 2: Frontend engineer
Weak:
- “Improved page load speed and user experience.”
Better:
- “Implemented code splitting and image optimization on React frontend, reducing Largest Contentful Paint (LCP) from 4.2s to 1.9s on 3G (55%) and improving Core Web Vitals scores from ‘Needs Improvement’ to ‘Good’.”
Even if you don’t have exact lab metrics, you can often use:
- Lighthouse reports
- Chrome DevTools audits
- WebPageTest results
Example 3: Full-stack / product engineer
Weak:
- “Built a new onboarding flow for users.”
Better:
- “Designed and implemented new onboarding flow (React + Node + Postgres), increasing signup completion rate from 63% to 78% and reducing average time-to-first-value from 2 days to 4 hours.”
This shows:
- Tech stack
- What changed (completion rate, time-to-value)
- Why it matters (better activation)
Example 4: DevOps / infrastructure
Weak:
- “Set up CI/CD pipeline and improved deployment process.”
Better:
- “Built GitHub Actions-based CI/CD pipeline with automated tests, linting, and blue-green deployments, reducing deployment time from 25 min to 8 min and enabling the team to increase release frequency from 1/month to 2/week with near-zero downtime.”
Example 5: Early-career / no production metrics
Even if you’re a student or working on side projects, you can still quantify:
Weak:
- “Built a task management web app using React and Node.js.”
Better:
- “Developed a task management web app (React, Node.js, MongoDB) with JWT auth and drag-and-drop UI; handled ~1,200 registered users, 10k+ tasks created, and achieved >95% Lighthouse performance score on desktop and mobile.”
Numbers can come from:
- Database counts
- Simple analytics (e.g., Google Analytics)
- Benchmarks you run locally
A systematic process to quantify resume impact
If you’re not used to thinking in metrics, here’s a step-by-step process.
Step 1: List your major contributions
For each role or project, write down:
- Features you built
- Systems you owned
- Bugs/incidents you resolved
- Refactors or migrations you led
- Tooling or automation you introduced
Keep this list high-level for now.
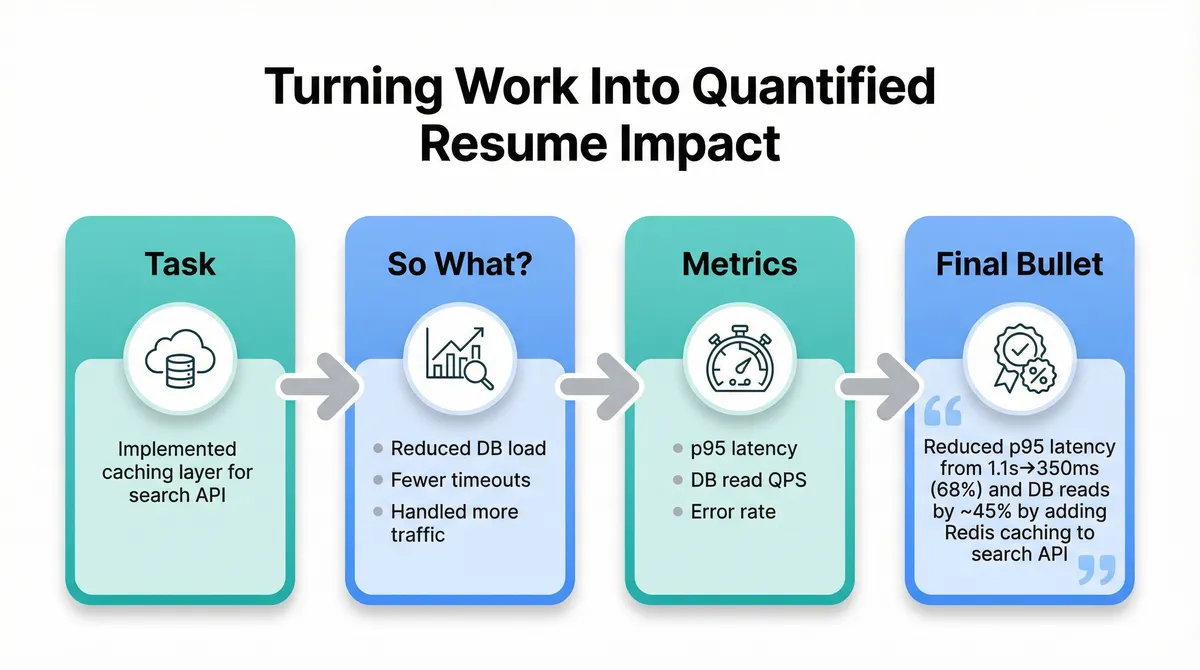
Step 2: Ask “So what?” repeatedly
For each item, ask:
- What problem did this solve?
- What got better? For whom?
- How would we know it worked?
Example:
- “Implemented caching layer.”
- So what? → Reduced DB load.
- So what? → System handled more traffic.
- So what? → Fewer timeouts during peak hours.
Each “so what” gets you closer to a measurable outcome.
Step 3: Identify measurable dimensions
For each contribution, consider:
- Performance: time, latency, throughput
- Reliability: errors, incidents, uptime
- Cost: infra cost, time saved
- Adoption: number of users, usage frequency
- Quality: bugs reduced, coverage increased
- Scale: volume of data, traffic, users
Pick 1–2 that best represent impact.
Step 4: Get or approximate the numbers
You won’t always have exact numbers, but you can often:
- Check dashboards/logs (APM, analytics, CI, monitoring)
- Ask your PM, tech lead, or manager
- Use before/after benchmarks you ran
- Estimate conservatively (and be honest)
Use phrases like:
- “approximately”, “about”, “~”
- “over X”, “more than X”
- “X–Y range” if it varies
Example:
- “Reduced CI pipeline time from ~18–20 min to ~7–8 min.”
Step 5: Write the bullet using the formula
[Action verb] + [what you did] + [how] + [measured outcome]
Then tighten it:
- Remove filler words (“successfully”, “helped to”)
- Front-load the impact if possible:
- “Reduced build time by 60% by refactoring CI pipeline…”
Common metrics for developer resumes (with examples)
Here’s a quick reference table you can adapt:
| Area | Metric Type | Example Resume Bullet Fragment |
|---|---|---|
| Backend APIs | Latency, throughput | “Reduced p95 latency from 800ms → 250ms (69%) on payments API” |
| Frontend | Web Vitals, bundle size | “Cut bundle size by 40%, improving LCP from 3.8s → 1.7s on mobile” |
| Databases | Query time, load | “Optimized queries, reducing avg response time by 55% and CPU by 30%” |
| DevOps | Deploy time, failure rate | “Lowered deployment failure rate from 15% → <2% via blue-green deploys” |
| Testing | Coverage, flakiness | “Increased test coverage from 52% → 85%; reduced flaky tests by 70%” |
| Cost optimization | Cloud spend, resources | “Saved ~$2k/month by rightsizing EC2 instances and adding autoscaling” |
| Product impact | Conversion, engagement | “Raised checkout conversion from 71% → 79% with UX and validation fixes” |
| Internal tools | Time saved, adoption | “Internal CLI tool used by 30+ engineers, saving ~3 hrs/week per person” |
How to quantify impact when you “just wrote code”
Many developers feel stuck because they “only implemented tickets” and don’t own big features. You can still quantify.
1. Quantify your piece of a larger project
Even if you didn’t own the entire project:
- Identify the overall project outcome.
- Clarify your specific contribution.
Example:
“Contributed to new subscription billing system that migrated 15k+ customers with zero data loss; implemented invoice generation service (Node, Postgres) and idempotent retry logic.”
You’re not claiming the whole project; you’re clearly stating your part.
2. Use team-level metrics (carefully)
If your team has clear outcomes:
“Part of 4-person team that reduced platform-wide 5xx errors by 60%; owned authentication and rate-limiting changes for public APIs.”
Make sure:
- You actually contributed to that outcome.
- You don’t phrase it as if you single-handedly did it.
3. Quantify learning and ownership progression
For junior roles, it’s acceptable to highlight:
- On-call participation:
- “Handled 10+ production incidents as secondary on-call, resolving 4 independently.”
- Code review involvement:
- “Reviewed 80+ PRs per quarter, focusing on performance and readability.”
These aren’t as strong as business metrics, but they still show growth and responsibility.
Common mistakes when quantifying resume impact
Mistake 1: Using vanity metrics
Not all numbers are meaningful. Avoid:
- “Wrote 20k+ lines of code.”
- “Closed 300+ Jira tickets.”
- “Made 150+ commits.”
Volume of output doesn’t equal impact. Focus on outcomes, not activity.
Mistake 2: Being unrealistically precise or inflated
If you write:
- “Increased revenue by exactly 27.34%”
for a feature that indirectly affects revenue, it looks made up.
Use reasonable approximations:
- “~25–30%”
- “about 25%”
- “low-to-mid 20% range”
And never claim company-wide revenue changes unless you directly owned pricing, billing, or core monetization.
Mistake 3: Over-crediting yourself
Avoid bullets that imply solo ownership of large, multi-team efforts:
- “Rebuilt company’s entire microservices architecture.”
Instead:
- “Co-led migration of 5 core services from monolith to microservices (Go, gRPC, Kubernetes) as part of 6-person platform team, improving deployment frequency from monthly to daily.”
Mistake 4: Using vague qualifiers instead of numbers
Phrases like:
- “significantly improved”
- “greatly reduced”
- “massively increased”
are red flags. Replace them with real numbers or remove the adverb.
Mistake 5: Ignoring baseline values
“Reduced latency by 200ms” means very different things depending on the baseline:
- From 250ms → 50ms (great)
- From 10s → 9.8s (not great)
Whenever possible, show before and after:
- “Reduced p95 latency from 1.5s → 350ms (77%).”
Best practices for writing quantified bullet points
1. Lead with the outcome when possible
This makes your resume scannable:
- “Reduced deployment time by 60% by redesigning CI pipeline with parallelized test stages (GitHub Actions, Docker).”
Instead of:
- “Redesigned CI pipeline with parallelized test stages (GitHub Actions, Docker), reducing deployment time by 60%.”
Both are fine, but starting with the impact makes it pop.
2. Use strong, specific verbs
Replace weak verbs:
- “Worked on”, “helped with”, “responsible for”
with stronger ones:
- “Designed”, “Implemented”, “Optimized”, “Refactored”, “Led”, “Automated”, “Migrated”, “Scaled”
Example:
- “Helped with migrating database”
→ “Migrated 4 core tables (15M+ rows) from MySQL to Postgres with zero downtime using dual-write and backfill strategy.”
3. Keep bullets concise but information-dense
Aim for:
- 1–2 lines per bullet (max 3)
- 3–6 bullets per role
Each bullet should communicate:
- Your action
- The tech/context
- The measurable impact
4. Align metrics with the role you want
If you’re applying for:
- Backend roles: Emphasize performance, scalability, reliability.
- Frontend roles: Emphasize Web Vitals, UX impact, accessibility, engagement.
- DevOps/SRE: Emphasize uptime, MTTR, deployment frequency, infra cost.
- Product engineering: Emphasize user metrics, conversion, adoption.
If you’re preparing with structured patterns (e.g., DSA, system design), you can use the same mindset on your resume: show how your work improved real systems, not just that you wrote code. When you practice with tools like Thita’s AI interview practice: free mock interview simulator with real-time feedback for technical interviews, you can also rehearse how you’d speak to these metrics in an interview.
5. Reuse metrics across resume, LinkedIn, and interviews
Once you’ve done the work to quantify your impact:
- Use the same numbers in:
- Resume bullet points
- LinkedIn experience section
- Interview answers (“Tell me about a time you improved performance?”)
Consistency helps you tell a coherent story and shows you actually know your impact.
Examples: Fully quantified experience sections
Here are a couple of end-to-end examples.
Example: Mid-level backend engineer
Backend Engineer – XYZ Payments (2021–Present)
- Reduced p95 latency on core payments API from 1.3s → 420ms (68%) by introducing Redis caching, optimizing SQL queries, and adding async processing for non-critical operations (Node.js, Postgres, Redis).
- Designed and implemented idempotent charge endpoint handling 3k+ req/min with exactly-once semantics, reducing duplicate charge incidents from ~15/month to 0.
- Cut monthly AWS costs for the payments service by 22% (~$4k/month) by rightsizing EC2 instances, enabling auto-scaling policies, and migrating static assets to S3 + CloudFront.
- Increased integration test coverage from 48% → 82% on the payments module, reducing production bugs related to payment failures by ~40% over 2 quarters.
- Collaborated with data and product teams to launch a new pricing model, enabling A/B testing for discount strategies and contributing to a ~7% lift in ARPU on targeted cohorts.
Example: Frontend engineer
Frontend Engineer – ABC SaaS (2020–2023)
- Improved dashboard load time by 55% (LCP 3.6s → 1.6s on 3G) by implementing route-based code splitting, image lazy-loading, and prefetching critical data (React, Webpack).
- Led redesign of onboarding flow, increasing signup completion from 69% → 83% and reducing average time-to-first-report from 1.5 days → 6 hours, based on Mixpanel funnels.
- Built reusable charting components (D3.js) adopted by 5+ teams, reducing duplicate code by ~1.2k LOC and standardizing data visualization patterns across the app.
- Implemented accessibility improvements (ARIA roles, keyboard navigation, color contrast fixes), raising Lighthouse accessibility score from 72 → 96 and passing WCAG 2.1 AA for key flows.
- Instrumented front-end error tracking with Sentry, reducing uncaught client errors in production by ~60% over 3 months via prioritized bug fixing.
Key takeaways
- Every strong developer resume bullet answers: What changed because I did this, and how do I know?
- Use the formula: Action + What + How + Measurable Outcome.
- Quantify across performance, reliability, cost, user impact, code quality, and scale.
- Prefer before/after numbers and percentages over vague claims.
- Avoid vanity metrics and inflated numbers; approximate honestly when needed.
- Think like an engineer: treat your resume as a system whose success you can measure.
Once you start tracking impact in your day-to-day work—latency charts, feature adoption, incident counts—writing quantified bullet points becomes straightforward. And in interviews (including AI mock interviews like AI Mock Interviews vs Real Interviews: Do They Actually Help?), these same metrics become the backbone of strong, concrete stories about your experience.