
Data Science
End-to-End Data Science Projects That Impress Interviewers
Most data science candidates list “Built an ML model to predict X” on their resume. Interviewers have seen hundreds of these. What actually stands out are en...
Most data science candidates list “Built an ML model to predict X” on their resume. Interviewers have seen hundreds of these. What actually stands out are end-to-end data science projects: work that starts from a vague problem, touches raw data, applies modeling thoughtfully, and ends with a decision or product that someone could actually use.
This post walks through how to design and execute end-to-end data science projects that genuinely impress interviewers—projects you can defend in depth during data science interviews and that demonstrate real-world skills, not just model training.
We’ll cover how to choose ideas, structure your work, what to show in your portfolio projects, and how to talk about them under pressure.
What Makes a Data Science Project “End-to-End”?
An end-to-end data science project mimics how work happens in a real team. It’s not just:
- “I trained a RandomForest on Kaggle dataset X and got 0.9 accuracy.”
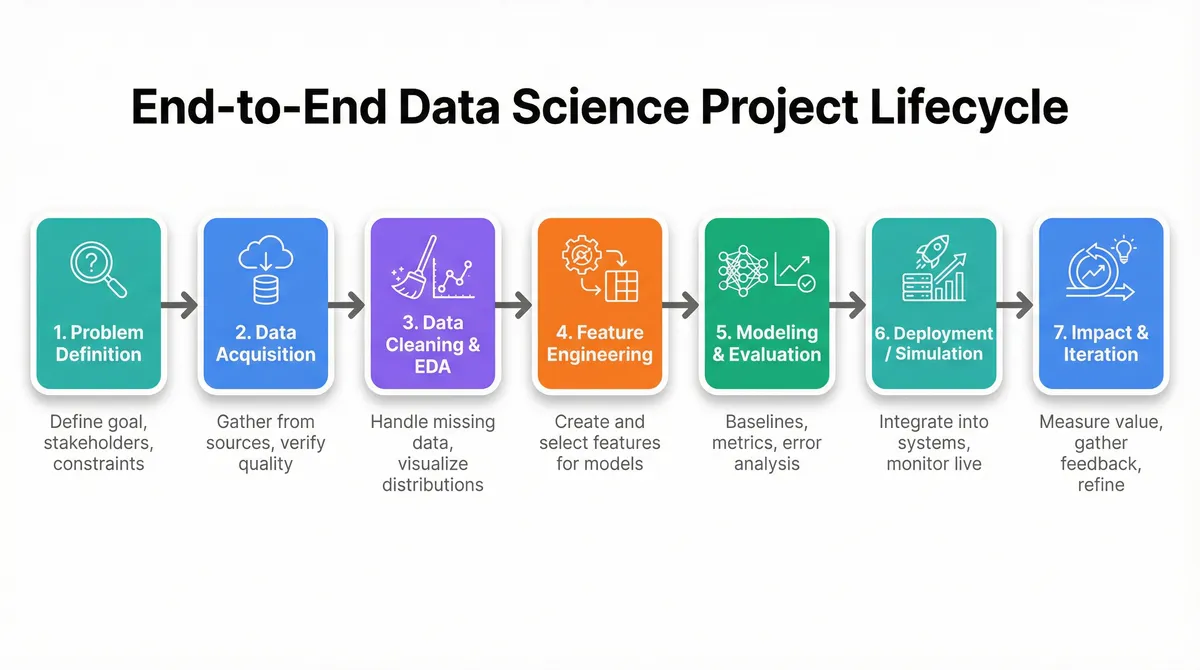
Instead, it covers the full lifecycle:
- Problem formulation – What decision or metric are we trying to improve?
- Data acquisition – How do we get the data? APIs, scraping, internal logs, public datasets, etc.
- Data understanding & cleaning – Exploratory data analysis, missing data, leakage checks.
- Feature engineering – Turning raw data into meaningful inputs.
- Modeling & evaluation – Baselines, metrics, cross-validation, error analysis.
- Deployment or simulation – API, dashboard, batch pipeline, or at least a realistic mock of one.
- Impact framing – How does this change a business metric or user experience?
Projects that hit all of these are rare in candidate portfolios. That’s why they stand out.
How to Choose End-to-End Data Science Project Ideas
Criteria for High-Signal Portfolio Projects
When you’re picking data science projects to invest time in, optimize for:
-
Real decision or action
The project should clearly answer: “What would someone do with this model or analysis?” -
Non-trivial data work
Show you can handle messy, multi-table, or time-based data. A single clean CSV is fine to start, but you’ll stand out more if you show joins, schema design, or log-style data. -
Clear success metrics
Accuracy alone is rarely enough. Think about precision/recall, uplift, business KPIs (revenue, churn, click-through rate). -
Tradeoff reasoning
Show that you can argue for simpler models, cost-effective solutions, or interpretable approaches when they make sense. -
Reproducibility
A reviewer should be able to run your project from scratch with clear instructions.
Example Project Themes That Work Well
Here are project types that map cleanly to real-world ML projects:
- Customer churn prediction for a subscription app (classification, imbalanced data, cost-sensitive decisions).
- Product recommendation for an e-commerce site (ranking, collaborative filtering, implicit feedback).
- Time-series forecasting for demand, traffic, or sales (seasonality, evaluation on time splits).
- Anomaly detection on transaction logs or sensor data (unsupervised / semi-supervised).
- Search relevance for a small document collection (NLP, ranking, evaluation via NDCG/MAP).
You can implement any of these with public data or your own synthetic logs.
A Reusable Blueprint for End-to-End ML Projects
Let’s define a concrete template you can reuse. We’ll illustrate with an example: predicting customer churn for a fictional SaaS product.
1. Problem Definition
For churn prediction:
- Goal: Identify users likely to cancel in the next 30 days so we can target retention campaigns.
- Decision: Marketing will send a retention email or offer to the top N at-risk users each week.
- Constraints:
- False positives cost email budget and user annoyance.
- False negatives mean lost revenue.
Document this in a short README section: it shows you think like a product-aware data scientist.
2. Data Acquisition
Options:
- Use a public dataset (e.g., Telco Customer Churn from Kaggle).
- Simulate your own SaaS event logs (signups, logins, feature usage, subscription events).
- Combine multiple sources (CRM data + product usage logs).
For a realistic feel, aim for:
- Event-level logs:
user_id,timestamp,event_type(login, feature_use, plan_change). - Static attributes: signup cohort, plan type, country, acquisition channel.
Show in your notebook or scripts how raw data is loaded, merged, and versioned (e.g., data/raw, data/processed directories).
3. Data Cleaning and Exploratory Data Analysis (EDA)
Interviewers often dig here. They want to see:
- How you handle missing values and outliers.
- How you check for data leakage (features that wouldn’t be available at prediction time).
- How you understand class imbalance (churners vs non-churners).
Example EDA steps:
- Plot churn rate by plan type, tenure, and usage frequency.
- Check distributions of numeric features; log-transform if heavily skewed.
- Verify that features are computed from data before the churn window.
4. Feature Engineering
This is where many portfolio projects are too thin. Strong projects show thoughtfulness here.
For churn:
- Aggregations over time windows:
- Number of logins last 7 / 30 / 90 days.
- Number of key feature uses in last 30 days.
- Days since last login.
- Trend features:
- Change in usage between last 30 days vs previous 30 days.
- Engagement scores:
- Weighted sum of different event types.
- Customer attributes:
- Plan type, country, acquisition channel, tenure.
A simple example in Python:
PYTHON
This shows:
- Time-aware feature construction.
- Avoiding leakage by cutting off features before churn.
5. Modeling and Evaluation
Now, the part everyone jumps to—but you’ll do it with structure.
Establish a Baseline
Before complex models:
- Heuristic baseline: e.g., “Users with no login in last 30 days are churn.”
- Simple model: Logistic regression with a few key features.
Compute metrics:
- ROC-AUC
- Precision, recall at different thresholds
- Precision@K (top K users by risk score)
Then compare to more complex models (RandomForest, XGBoost, LightGBM).
Time-Aware Evaluation
For churn or any temporal problem, avoid random train/test splits. Use time-based splits:
- Train on users from months 1–6, validate on month 7, test on month 8.
- Or use rolling-origin evaluation.
This is an important interview talking point: it shows you understand distribution shift and information leakage in time, a key aspect emphasized in the data science interview preparation roadmap.
Error Analysis
Go beyond the overall metric:
- Inspect confusion matrices.
- Analyze high-confidence false positives and false negatives.
- Segment performance by plan type, country, or tenure.
This is where you can derive product insights: e.g., “New users on the basic plan churn quickly unless they use feature X within the first week.”
6. Deployment or Simulation
You don’t need a full Kubernetes cluster. But you do want to show:
- How the model could be used in production.
- That you understand APIs, batch jobs, or dashboards.
Options:
- Simple REST API with FastAPI or Flask to serve predictions.
- Batch scoring script that reads a CSV of users and outputs risk scores.
- Dashboard (Streamlit, Dash) for business users to explore churn risk segments.
Example: minimal FastAPI endpoint for churn prediction.
PYTHON
This is enough to show you understand how a model becomes a service.
7. Impact Framing
Finally, tie it back to impact:
- “If we target the top 5% highest-risk users each week, we capture 40% of eventual churners with a precision of 0.3.”
- “At an average customer lifetime value of $X, this could save approximately $Y/month if the campaign reduces churn for 10% of contacted users.”
Even rough back-of-the-envelope calculations demonstrate business thinking.
Three Concrete End-to-End Project Examples
To make this more actionable, here are three project outlines you can adapt.
1. E-Commerce Product Recommendation System
Goal: Recommend top N products to each user based on past behavior.
Data:
- Public datasets: Retail transaction logs (e.g., Online Retail II), or MovieLens for ratings.
- Tables:
users: user_id, signup_date, country.items: item_id, category, price.events: user_id, item_id, event_type (view, add_to_cart, purchase), timestamp.
Pipeline:
- Problem definition: Maximize click-through rate on recommendation carousel.
- Feature engineering:
- User-level: categories viewed, recency/frequency of activity.
- Item-level: popularity, price, category.
- User-item: co-occurrence counts, similarity scores.
- Models:
- Baseline: popularity-based recommendations.
- Collaborative filtering (matrix factorization).
- Optional: content-based using item attributes.
- Evaluation:
- Offline: Hit@K, NDCG@K on a held-out time window.
- Simulated A/B: compare baseline vs model on historical logs.
- Deployment:
- API endpoint:
GET /recommendations?user_id=...returning top N item_ids. - Simple UI mock or notebook showing example recommendations.
- API endpoint:
2. Time-Series Demand Forecasting
Goal: Predict daily demand for a set of products or locations.
Data:
- Public: M5 Forecasting competition dataset, or any sales-by-day dataset.
- Features:
- Historical demand.
- Calendar features (day of week, holidays).
- Price or promotion indicators if available.
Pipeline:
- Problem definition: Lower stockouts and overstock by improving forecast accuracy.
- Feature engineering:
- Lag features: demand_t-1, t-7, t-14, etc.
- Rolling means: 7-day, 30-day moving averages.
- Seasonality indicators: month, week-of-year.
- Models:
- Baseline: naive (y_t = y_{t-1}), seasonal naive.
- Classical: ARIMA, Prophet.
- ML: Gradient boosting or deep learning (LSTM, Temporal Fusion Transformer) for multiple series.
- Evaluation:
- Time-based splits.
- Metrics: MAPE, RMSE, WAPE.
- Deployment:
- Batch pipeline that reads latest data and outputs forecasts for next 14 days.
- Simple dashboard plotting forecast vs actuals for selected products.
3. NLP-Powered Support Ticket Triage
Goal: Automatically route support tickets to the right team and predict priority.
Data:
- Public: Kaggle “Customer Support on Twitter”, or any labeled support ticket dataset.
- Fields:
ticket_id,text,created_at,assigned_team,priority,resolved_at.
Pipeline:
- Problem definition: Reduce manual triage time and misrouted tickets.
- Text preprocessing:
- Tokenization, lowercasing, handling URLs and mentions.
- Optional: lemmatization, stopword removal.
- Feature engineering:
- Baseline: TF-IDF vectors.
- Advanced: Pretrained embeddings (BERT, DistilBERT).
- Models:
- Multi-class classification for
assigned_team. - Separate model or regression for
priorityor expected resolution time.
- Multi-class classification for
- Evaluation:
- Accuracy / F1 per class.
- Confusion matrix analysis to find confusing classes.
- Deployment:
- Minimal API that accepts ticket text and returns predicted team + priority.
- Simple web form mock for a support agent.
How to Structure Your Project Repository
Interviewers often browse your GitHub. A clean, production-like structure sends a strong signal.
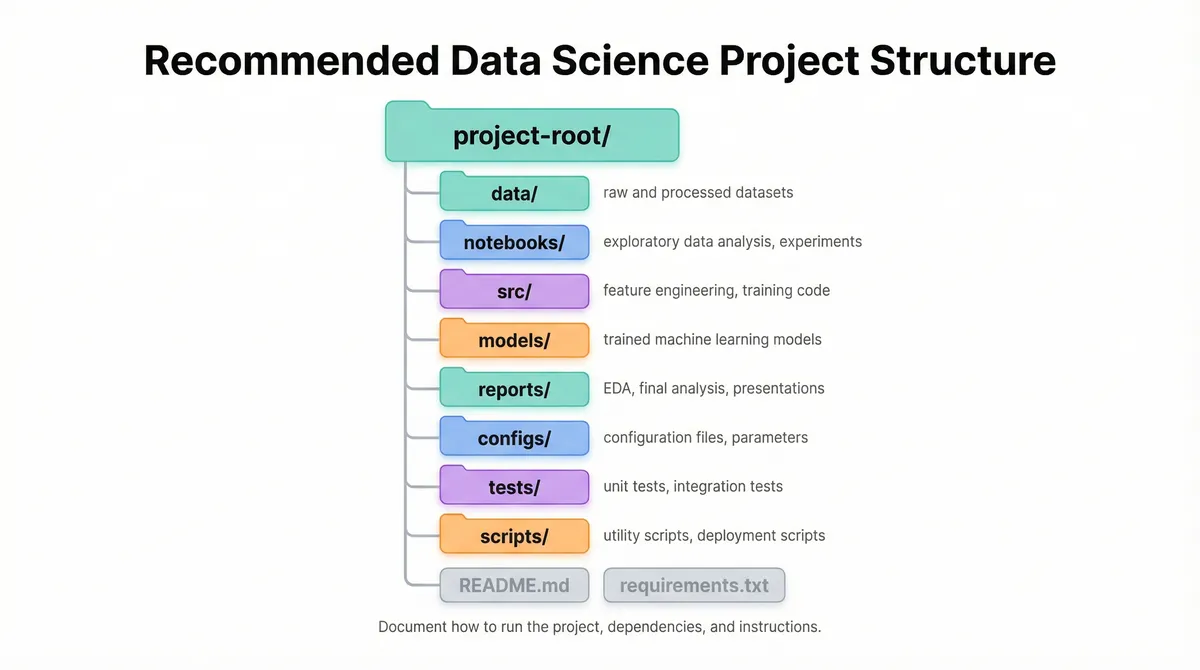
A solid starting layout:
README.md– Problem statement, dataset, how to run, results summary.data/raw/– Original data.processed/– Cleaned/feature data.
notebooks/– EDA, experiments (clearly numbered, e.g.,01_eda.ipynb).src/features/– Feature engineering scripts.models/– Training and evaluation scripts.utils/– Shared helpers.
models/– Saved model artifacts.reports/figures/– Plots used in writeups.final_report.md– Narrative of findings.
requirements.txtorpyproject.toml– Dependencies.configs/– YAML/JSON configs for experiments (optional but impressive).tests/– Basic unit tests for key functions (even 2–3 tests show good habits).
Common Mistakes in Data Science Portfolio Projects
1. Focusing Only on Model Performance
Pitfall:
- “I achieved 99% accuracy on MNIST with a CNN.”
Issues:
- MNIST is saturated and not representative of messy business data.
- No discussion of how predictions are used.
- No tradeoff discussion (e.g., latency vs accuracy, interpretability vs complexity).
Fix:
- Emphasize problem framing, evaluation strategy, and decision thresholds, not just the top-line score.
2. Ignoring Data Leakage and Evaluation Design
Pitfall:
- Using future data to build features (e.g., average usage over the entire user lifetime to predict churn).
- Random train/test split on time-series or user-level data where leakage across users occurs.
Fix:
- Always ask: “At prediction time, what information is truly available?”
- For temporal data, use time-based splits.
- For user-level problems, ensure that users in train and test don’t overlap when appropriate.
3. No Baseline or Ablation Studies
Pitfall:
- Jumping straight to complex models without comparing to simple baselines.
Fix:
- Implement:
- A naive baseline (e.g., predict mean, last value, majority class).
- A simple linear/logistic model.
- Do at least one ablation:
- Remove a group of features and show impact on metrics.
- Compare with/without a complex component (e.g., deep model vs bag-of-words).
4. Unclear or Hard-to-Reproduce Code
Pitfall:
- One giant notebook with data download, EDA, feature engineering, training, and evaluation all mixed.
- No instructions on how to run anything.
Fix:
- Separate concerns: notebooks for exploration, scripts/modules for reusable logic.
- Include:
- Clear setup instructions.
- Example commands (e.g.,
python src/train_model.py --config configs/base.yaml). - Seed fixing for reproducibility where relevant.
5. Over-Claiming Real-World Impact
Pitfall:
- “This model will save the company $10M per year” with no grounding.
Fix:
- Use careful language:
- “If deployed in a similar environment, this approach could reduce churn by X% under assumptions A, B, C.”
- Show the calculation steps and assumptions explicitly.
How to Present Your Projects in Data Science Interviews
Building strong ml projects is half the battle; explaining them is the other half.
Use a Clear Narrative Structure
When asked “Tell me about a data science project you’re proud of,” structure your answer:
-
Context & Goal
- Who is the user or stakeholder?
- What problem are you solving?
-
Data & Challenges
- What data did you have?
- What were the main data issues?
-
Approach
- Feature engineering.
- Modeling choices.
- Evaluation design.
-
Results & Insights
- Metrics.
- Key findings.
- What you’d do next.
-
Tradeoffs & Learnings
- What didn’t work.
- What you’d change with more time or data.
Anticipate Common Follow-Up Questions
For strong portfolio projects, expect questions like:
- How did you avoid data leakage?
- Why did you choose metric X instead of Y?
- How would your approach change if you had 10x more data?
- How would you deploy this in production? Batch vs real-time?
- How do you handle concept drift or changing user behavior?
Practice answering these out loud. A tool like an AI mock interviewer can help you stress-test your explanations and identify weak spots.
Best Practices Checklist for High-Impact Portfolio Projects
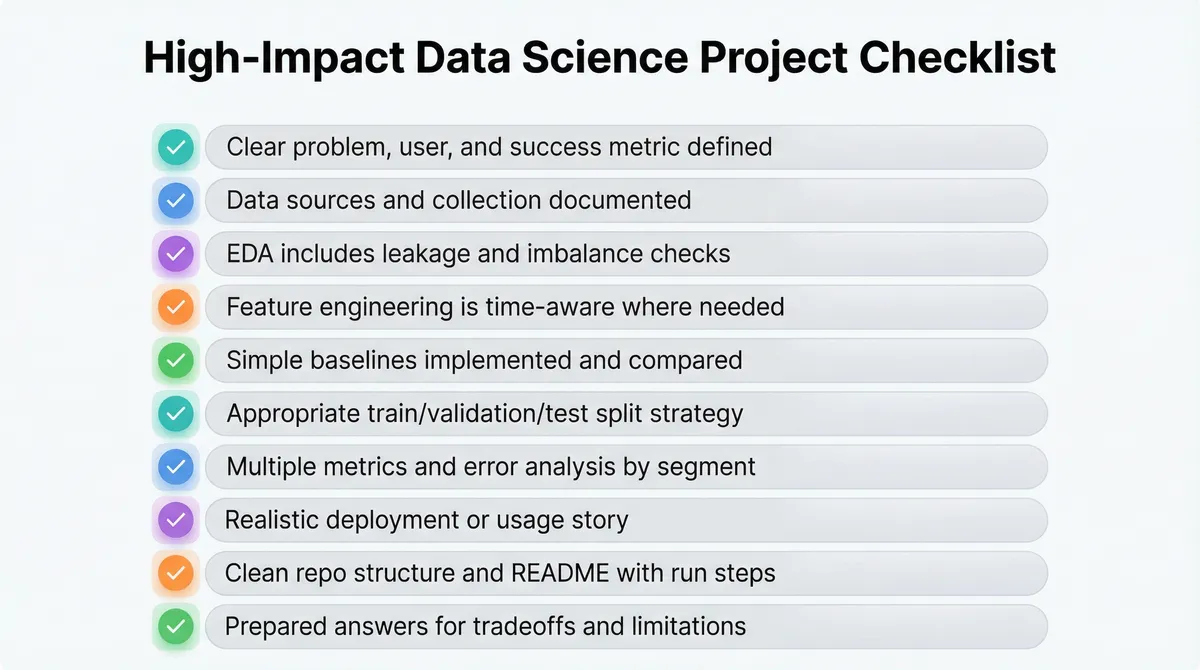
Use this as a quick checklist before you call a project “done”:
- Problem statement includes user, decision, and success metric.
- Data sources and collection process are documented.
- EDA covers missing values, distributions, leakage checks, and target imbalance.
- Feature engineering is time-aware (where applicable) and motivated.
- At least one simple baseline model is implemented and compared.
- Evaluation uses appropriate splits (time-based, user-based) and multiple metrics.
- Error analysis includes breakdowns by segment and inspection of failure cases.
- There is a clear story for how predictions would be used in practice.
- Repository is organized, with a README and runnable instructions.
- You can explain tradeoffs and design decisions under questioning.
Key Takeaways
- End-to-end data science projects are about decisions and impact, not just models.
- Strong portfolio projects demonstrate:
- Thoughtful problem framing and data understanding.
- Time-aware, leakage-free feature engineering and evaluation.
- Clear baselines, error analysis, and tradeoff reasoning.
- A plausible path to deployment or product integration.
- A clean repository and a coherent narrative can turn a good project into a standout one in data science interviews.
If you build even 1–2 such ml projects and can explain them deeply, you’ll differentiate yourself from the majority of candidates whose “portfolio projects” stop at model training on a Kaggle dataset.