
Data Science
Statistics Questions Commonly Asked in Data Science Interviews
Most data science interviews are lost not on deep learning, but on basic statistics. You’ll be building a model, debugging an A/B test, or interpreting a met...
Most data science interviews are lost not on deep learning, but on basic statistics. You’ll be building a model, debugging an A/B test, or interpreting a metric—and suddenly the interviewer asks a “simple” question about p-values, confidence intervals, or conditional probability. This post walks through the core statistics interview questions that come up again and again in data science and ML interviews, and how to answer them with clarity and rigor.
We’ll focus on the concepts you actually use in practice: from probability and distributions to hypothesis testing, regression, and experimental design. Along the way, we’ll highlight common pitfalls and provide concrete examples you can rehearse before your next interview.
1. Core Probability Concepts for Data Science Statistics Interviews
Most statistics interview questions start from probability. Interviewers want to know whether you can reason about uncertainty, not just plug numbers into formulas.
1.1 What is the difference between probability and statistics?
Typical question:
“Explain the difference between probability and statistics in the context of data science.”
Answer structure:
- Probability: Start from a known model, reason about possible data.
- Example: Given a fair coin, what’s the probability of 7 heads in 10 flips?
- Statistics: Start from observed data, infer the underlying model.
- Example: Given 10 flips with 7 heads, is the coin fair?
In ML and data science:
- Probability is used to define models (e.g., likelihood of labels given features).
- Statistics is used to estimate parameters, evaluate models, and reason about uncertainty.
1.2 Conditional probability and Bayes’ theorem
Common interview angle: medical tests, spam filters, or fraud detection.
Key definitions:
- Conditional probability:
( P(A \mid B) = \frac{P(A \cap B)}{P(B)} ) - Bayes’ theorem:
( P(A \mid B) = \frac{P(B \mid A) P(A)}{P(B)} )
Example question:
“A disease affects 1% of the population. The test has 99% sensitivity (true positive rate) and 95% specificity (true negative rate). If a person tests positive, what is the probability they actually have the disease?”
Solution outline:
Let:
- D = has disease, ¬D = no disease
- T+ = test positive
Given:
- P(D) = 0.01
- P(T+ | D) = 0.99
- P(T+ | ¬D) = 1 − specificity = 0.05
We want P(D | T+):
[ P(D \mid T+) = \frac{P(T+ \mid D) P(D)}{P(T+ \mid D)P(D) + P(T+ \mid \neg D)P(\neg D)} ]
[ = \frac{0.99 \cdot 0.01}{0.99 \cdot 0.01 + 0.05 \cdot 0.99} \approx \frac{0.0099}{0.0594} \approx 0.167 ]
So even with a “good” test, only ~16.7% of positives are true positives because the disease is rare.
What interviewers look for:
- Correct application of Bayes’ theorem.
- Intuition about base rates (class imbalance is everywhere in ML).
- Understanding how these concepts relate to the broader data science interview preparation roadmap.
1.3 Independence vs conditional independence
Typical question:
“What’s the difference between independence and conditional independence? Why does it matter in ML?”
- Independence: A and B are independent if
( P(A \cap B) = P(A)P(B) ) or ( P(A \mid B) = P(A) ). - Conditional independence: A and B are independent given C if
( P(A \cap B \mid C) = P(A \mid C)P(B \mid C) ).
Example:
- Rain (R) and carrying an umbrella (U) are not independent.
- Given “it’s cloudy” (C), rain and umbrella may still be dependent.
- But in some models, we assume things like: given the latent topic of a document, words are conditionally independent (Naive Bayes).
Conditional independence assumptions underlie many probabilistic models (Naive Bayes, graphical models). Interviewers want to see you can articulate that.
2. Random Variables and Common Distributions
Being fluent with distributions is essential for both probability interviews and ML interviews.
2.1 Discrete vs continuous random variables
Key definitions:
- Random variable: A variable whose possible values are outcomes of a random phenomenon.
- Discrete: Takes countable values (e.g., number of clicks).
- Continuous: Takes values in an interval (e.g., time on site, height).
You should be able to state:
- Expected value ( E[X] )
- Variance ( Var(X) )
- Examples and when they’re used
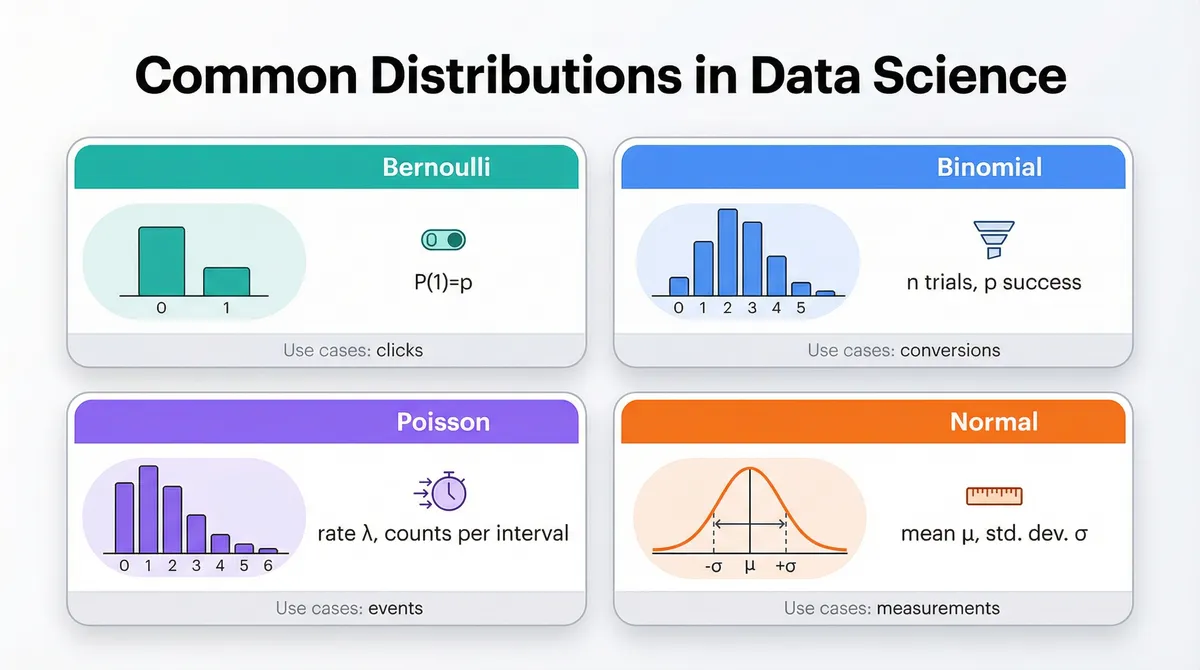
2.2 Common discrete distributions
Bernoulli distribution
- Single trial with success/failure.
- Parameter: p = P(success).
- Mean: p, Variance: p(1 − p).
- Use cases: click vs no click, churn vs no churn.
Binomial distribution
- Sum of n independent Bernoulli(p) trials.
- Parameters: n, p.
- Mean: np, Variance: np(1 − p).
- Use: number of successes in fixed number of trials (e.g., number of users who convert out of 1000).
Poisson distribution
- Counts events in a fixed interval with known average rate λ.
- Mean: λ, Variance: λ.
- Use: number of events per time unit (requests per second, defects per batch).
Typical interview question:
“When would you model count data with binomial vs Poisson?”
Answer outline:
- Use binomial when:
- Fixed number of trials n.
- Each trial is success/failure with probability p.
- Use Poisson when:
- No fixed upper bound on count.
- Events occur independently in time with an average rate λ.
- Often emerges as a limit of binomial when n is large and p is small.
2.3 Common continuous distributions
Normal (Gaussian) distribution
- Symmetric, bell-shaped.
- Parameters: mean μ, variance σ².
- Central in CLT and many ML models (e.g., residuals in linear regression).
Exponential distribution
- Time between Poisson events.
- Parameter: rate λ.
- Memoryless property: P(T > s + t | T > s) = P(T > t).
Uniform distribution
- All outcomes in an interval [a, b] are equally likely.
- Often used in random initialization, simulation.
3. Expectations, Variance, and Covariance
These are the building blocks of statistical reasoning and many ML algorithms.
3.1 Linearity of expectation
Typical question:
“If X and Y are random variables, what is E[X + Y]? Do X and Y need to be independent?”
Key points:
- Linearity: ( E[X + Y] = E[X] + E[Y] ) always holds, regardless of independence.
- Extends to sums: ( E[\sum_i X_i] = \sum_i E[X_i] ).
This is a core trick in many probability interview problems.
3.2 Variance and standard deviation
- ( Var(X) = E[(X - E[X])^2] ).
- ( Var(X) = E[X^2] - (E[X])^2 ).
- Standard deviation = √Var(X).
Sum of independent variables:
- If X, Y are independent:
( Var(X + Y) = Var(X) + Var(Y) ).
3.3 Covariance and correlation
- Covariance:
( Cov(X, Y) = E[(X - E[X])(Y - E[Y])] ). - Correlation (Pearson):
( \rho_{X,Y} = \frac{Cov(X, Y)}{\sigma_X \sigma_Y} ).
Typical question:
“Does zero correlation imply independence?”
- In general: no.
- For jointly normal variables, zero correlation does imply independence.
- In many ML contexts, we assume approximate normality, but you should still know the distinction.
4. Hypothesis Testing and p-Values in Data Science Statistics
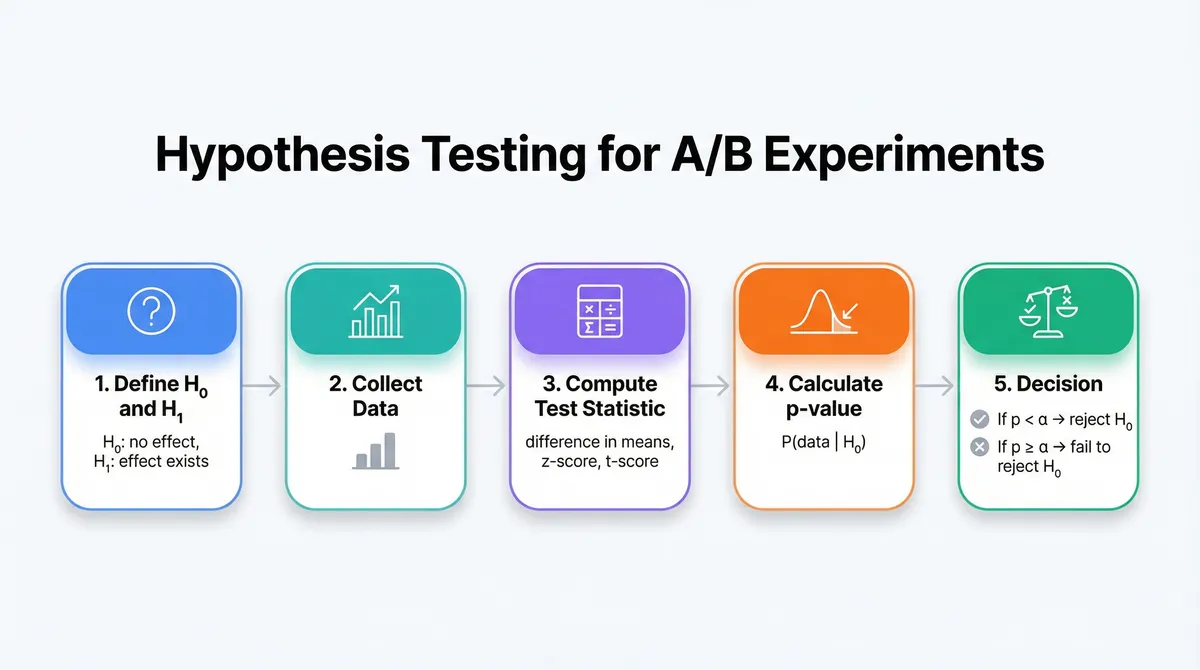
Hypothesis testing is one of the most common sources of statistics interview questions, especially around A/B testing and experimentation.
4.1 Null and alternative hypotheses
Typical question:
“Explain what a p-value is to a product manager.”
First, define hypotheses:
- Null hypothesis (H₀): Default assumption (e.g., “new feature has no effect on conversion rate”).
- Alternative hypothesis (H₁): What you want to show (e.g., “new feature changes conversion rate”).
4.2 What is a p-value?
Definition:
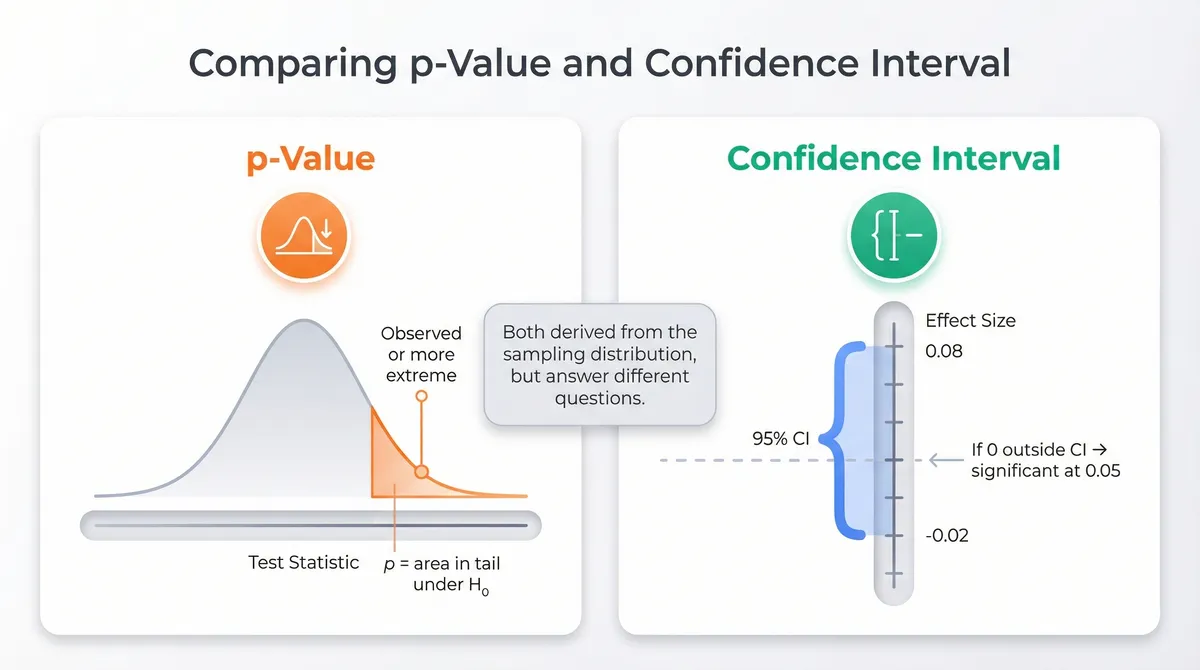
- The p-value is the probability, under the assumption that H₀ is true, of observing a result at least as extreme as the one you actually observed.
Plain language explanation:
- “If there were truly no difference between control and treatment, how surprising is the data we saw?”
- Small p-value → data is unlikely under H₀ → evidence against H₀.
Common misconception to avoid:
- A p-value is not:
- The probability that H₀ is true.
- The probability that the result happened by chance.
- The effect size.
Interviewers often test whether you can articulate this clearly.
4.3 Type I and Type II errors, significance, and power
Definitions:
- Type I error (α): Rejecting H₀ when it’s true (false positive).
- Type II error (β): Failing to reject H₀ when it’s false (false negative).
- Significance level (α): Threshold for p-value, commonly 0.05.
- Power (1 − β): Probability of correctly rejecting H₀ when H₁ is true.
Typical question:
“In an A/B test, what does it mean to have 80% power at α = 0.05?”
Answer:
- If the true effect size is at least the one we powered for, we have an 80% chance of detecting it (p < 0.05).
5. Confidence Intervals and Their Interpretation
5.1 What is a confidence interval?
Definition:
- A 95% confidence interval for a parameter θ is an interval constructed by a procedure that, over many repeated samples, will contain the true θ in 95% of those samples.
Typical question:
“How would you explain a 95% confidence interval to a non-technical stakeholder?”
Better phrasing:
- “If we repeated this experiment many times, 95% of the intervals we compute this way would include the true value. For this specific experiment, it gives a plausible range for the effect size.”
5.2 Confidence interval vs p-value
Both come from the same underlying sampling distribution. Interviewers may ask:
“If the 95% CI for the difference in means excludes 0, what does that say about the p-value for a two-sided test?”
- If 0 is not in the 95% CI → p < 0.05.
- If 0 is in the 95% CI → p ≥ 0.05.
6. A/B Testing and Experimental Design Statistics Interview Questions
Experimentation is core to product data science roles.
6.1 Basic A/B test setup
Typical question:
“How would you design an A/B test to measure the impact of a new recommendation algorithm?”
Key points to cover:
- Unit of randomization (user, session, account).
- Random assignment to control (A) and treatment (B).
- Primary metric (e.g., click-through rate, revenue per user).
- Guardrail metrics (e.g., error rate, latency).
- Sample size and duration based on power analysis.
- Stopping rules to avoid peeking.
6.2 Sample size and power
You don’t need to derive formulas from scratch, but you should know:
- Sample size increases when:
- You want higher power.
- You want lower significance level (e.g., 0.01 vs 0.05).
- The expected effect size is small.
- The variance of the metric is large.
Interviewers may ask:
“How does required sample size change if you want to detect half the effect size?”
- Roughly, sample size scales with 1 / (effect size)².
- So halving effect size → ~4x sample size.
6.3 Common pitfalls in A/B tests
- Peeking: repeatedly checking results and stopping when p < 0.05 inflates Type I error.
- Multiple testing: running many experiments or checking many metrics without correction.
- Non-compliance: users not fully exposed to treatment.
- Interference: treatment on one user affects another (network effects).
- Seasonality: test duration too short to capture weekly/monthly cycles.
Many of these pitfalls are discussed in detail in the common mistakes when using AI for interview preparation post, which also highlights how to avoid errors in experimental reasoning.
7. Regression and Correlation in ML Interviews
Regression is where statistics meets machine learning most directly.
7.1 Linear regression basics
Typical question:
“Explain linear regression to a non-technical audience.”
Core points:
- We model a continuous outcome y as a linear combination of features X plus noise:
( y = X\beta + \epsilon ). - We estimate β by minimizing the sum of squared errors (ordinary least squares).
- The model outputs predictions and provides coefficients that indicate direction and magnitude of associations.
7.2 Assumptions of linear regression
Interviewers often ask:
“What assumptions does linear regression make? What happens if they’re violated?”
Key assumptions:
- Linearity: Relationship between predictors and outcome is linear.
- Independence: Errors are independent.
- Homoskedasticity: Constant variance of errors.
- Normality of errors (for inference).
- No perfect multicollinearity between predictors.
Violations:
- Non-linearity → biased predictions; use transformations or non-linear models.
- Heteroskedasticity → biased standard errors; use robust SEs.
- Multicollinearity → unstable estimates; remove or combine features.
7.3 Correlation vs causation
Classic interview trap:
“We observed that users who use feature X have 20% higher retention. Can we say feature X causes higher retention?”
You should highlight:
- Correlation does not imply causation.
- Possible confounders: power users may both use feature X and have higher retention.
- To infer causality, we need:
- Randomized experiments (A/B tests), or
- Strong observational methods (e.g., difference-in-differences, instrumental variables), with assumptions.
This topic often overlaps with broader data science interview preparation strategies that emphasize experimental design and causal inference.
8. Probability Interview Questions with Coding
Some data science and ML interviews combine probability and coding. Here’s a typical pattern.
8.1 Example: simulate a biased coin using a fair coin
Question:
“You have a function
fair_coin()that returns 0 or 1 with equal probability. Implementbiased_coin(p)that returns 1 with probability p (0 < p < 1). Assume p is given as a float.”
A simple approach uses the fact that random() in most languages already gives uniform [0, 1), but if you’re constrained to fair_coin() only, you can generate a binary expansion.
Here’s a Python-style solution using the built-in RNG (for interview whiteboard, focus on logic, not library calls):
PYTHON
If the interviewer insists on using only fair_coin():
- Generate a uniform random variable in [0, 1) via binary expansion.
- Compare to p’s binary expansion.
- In practice, you approximate with finite bits.
The key is to show you can connect uniform randomness to Bernoulli(p) outcomes.
For more coding interview preparation techniques that integrate AI tools and probability questions, see best ways to use AI for DSA and coding interview preparation.
9. Common Mistakes and Pitfalls in Statistics Interviews
Interviewers frequently probe for misunderstandings. Being aware of these helps you avoid traps.
9.1 Misinterpreting p-values
- Saying “p = 0.03 means there’s a 3% chance the null hypothesis is true.”
- Correct: “If the null hypothesis were true, there’s a 3% chance we’d observe data this extreme or more.”
9.2 Confusing confidence intervals with probability intervals
- Saying “There’s a 95% probability the true mean lies in this interval.”
- Frequentist CI: the procedure has 95% coverage; the parameter is fixed.
9.3 Ignoring base rates in conditional probability
- Overestimating the positive predictive value of rare-disease tests.
- Failing to account for class imbalance in ML settings.
9.4 Over-relying on correlation
- Inferring causality from observational correlations without considering confounders.
- Not thinking about experimental or quasi-experimental designs.
9.5 Misusing averages
- Using mean instead of median in heavy-tailed distributions (e.g., income, session length).
- Ignoring variance and distribution shape.
10. Best Practices for Preparing for Statistics Interview Questions
10.1 Build a mental “statistics toolkit”
Know how to quickly recall and explain:
- Core distributions (Bernoulli, Binomial, Poisson, Normal, Exponential).
- Key concepts: expectation, variance, covariance, correlation.
- Hypothesis testing, p-values, confidence intervals.
- A/B testing design and pitfalls.
- Regression assumptions and interpretation.
10.2 Practice explaining concepts at multiple levels
Interviewers may ask you to:
- Explain p-values to a statistician (formal).
- Explain p-values to a PM (intuitive).
- Explain p-values to an executive (business impact).
Practice giving layered answers: start intuitive, then add formal details if prompted.
10.3 Work through real interview-style problems
Most statistics questions are pattern-based. Just as you’d use DSA patterns to practice algorithms, you can think in terms of recurring statistics patterns:
- Base-rate & Bayes pattern: medical tests, spam filters.
- Sampling & CI pattern: survey results, experiment outcomes.
- A/B test pattern: feature launches, UI changes.
- Regression & correlation pattern: metrics drivers, forecasting.
You can rehearse these patterns in the same structured way you’d practice coding patterns. If you’re already using a pattern-based system for algorithms (e.g., a DSA patterns sheet), apply the same discipline to your statistics prep.
For integrated practice that mixes coding, probability, and ML reasoning, AI-driven mock interviews (like those at AI interview practice: free mock interview simulator with real-time feedback for technical interviews) can help simulate real scenarios and give you feedback on both your math and communication.
11. Visual Summaries
To consolidate, here are a few visual concepts that map directly to common interview questions.
12. Key Takeaways
- Statistics interview questions for data science and ML roles focus on probability reasoning, inference, and experimental thinking, not memorized formulas.
- Be fluent in:
- Conditional probability and Bayes’ theorem.
- Core distributions and their use cases.
- Hypothesis testing, p-values, and confidence intervals.
- A/B testing design, power, and common pitfalls.
- Regression assumptions and correlation vs causation.
- Practice explaining concepts at multiple abstraction levels and apply them to realistic scenarios (A/B tests, product metrics, ML models).
- Treat statistics prep like DSA prep: identify recurring patterns in questions and drill them until your reasoning is automatic.
If you can walk through these concepts clearly, with both mathematical correctness and practical intuition, you’ll be well-prepared for the statistics component of modern data science and ML interviews.